
Start with free basic visualizations. Upgrade to professional analytics with predictive models, custom dashboards, and actionable insights.
Create basic charts with sample data • Upgrade for advanced analytics
📁 Upload your CSV file to visualize
Free Tool: Basic charts with sample data only. No custom data upload, no predictive analytics, no automated insights.
Load a dataset to see visualization
⚠️ Sample data only - no custom uploads
Get professional analytics platform with custom dashboards, predictive models, and automated reporting for your actual business data
Or book a free consultation to discuss your needs
Ready to unlock powerful insights from your business data?
KPI & Performance Insights.
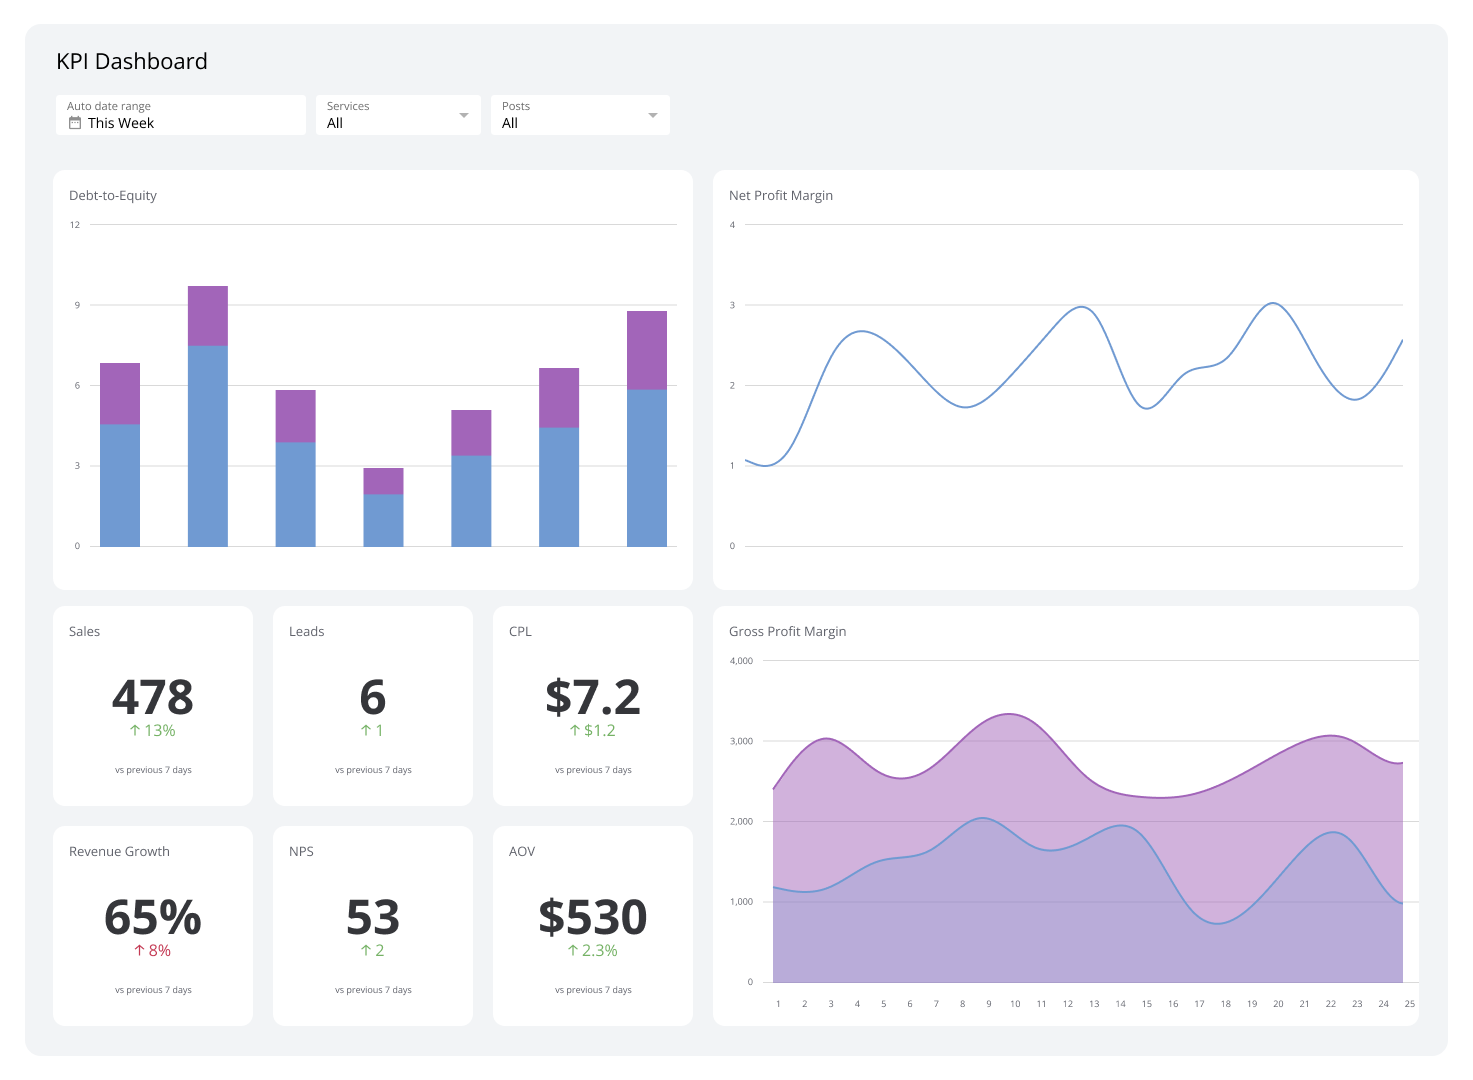
This is a working demonstration of real-time business intelligence.
Watch as all metrics update automatically every 5 seconds.
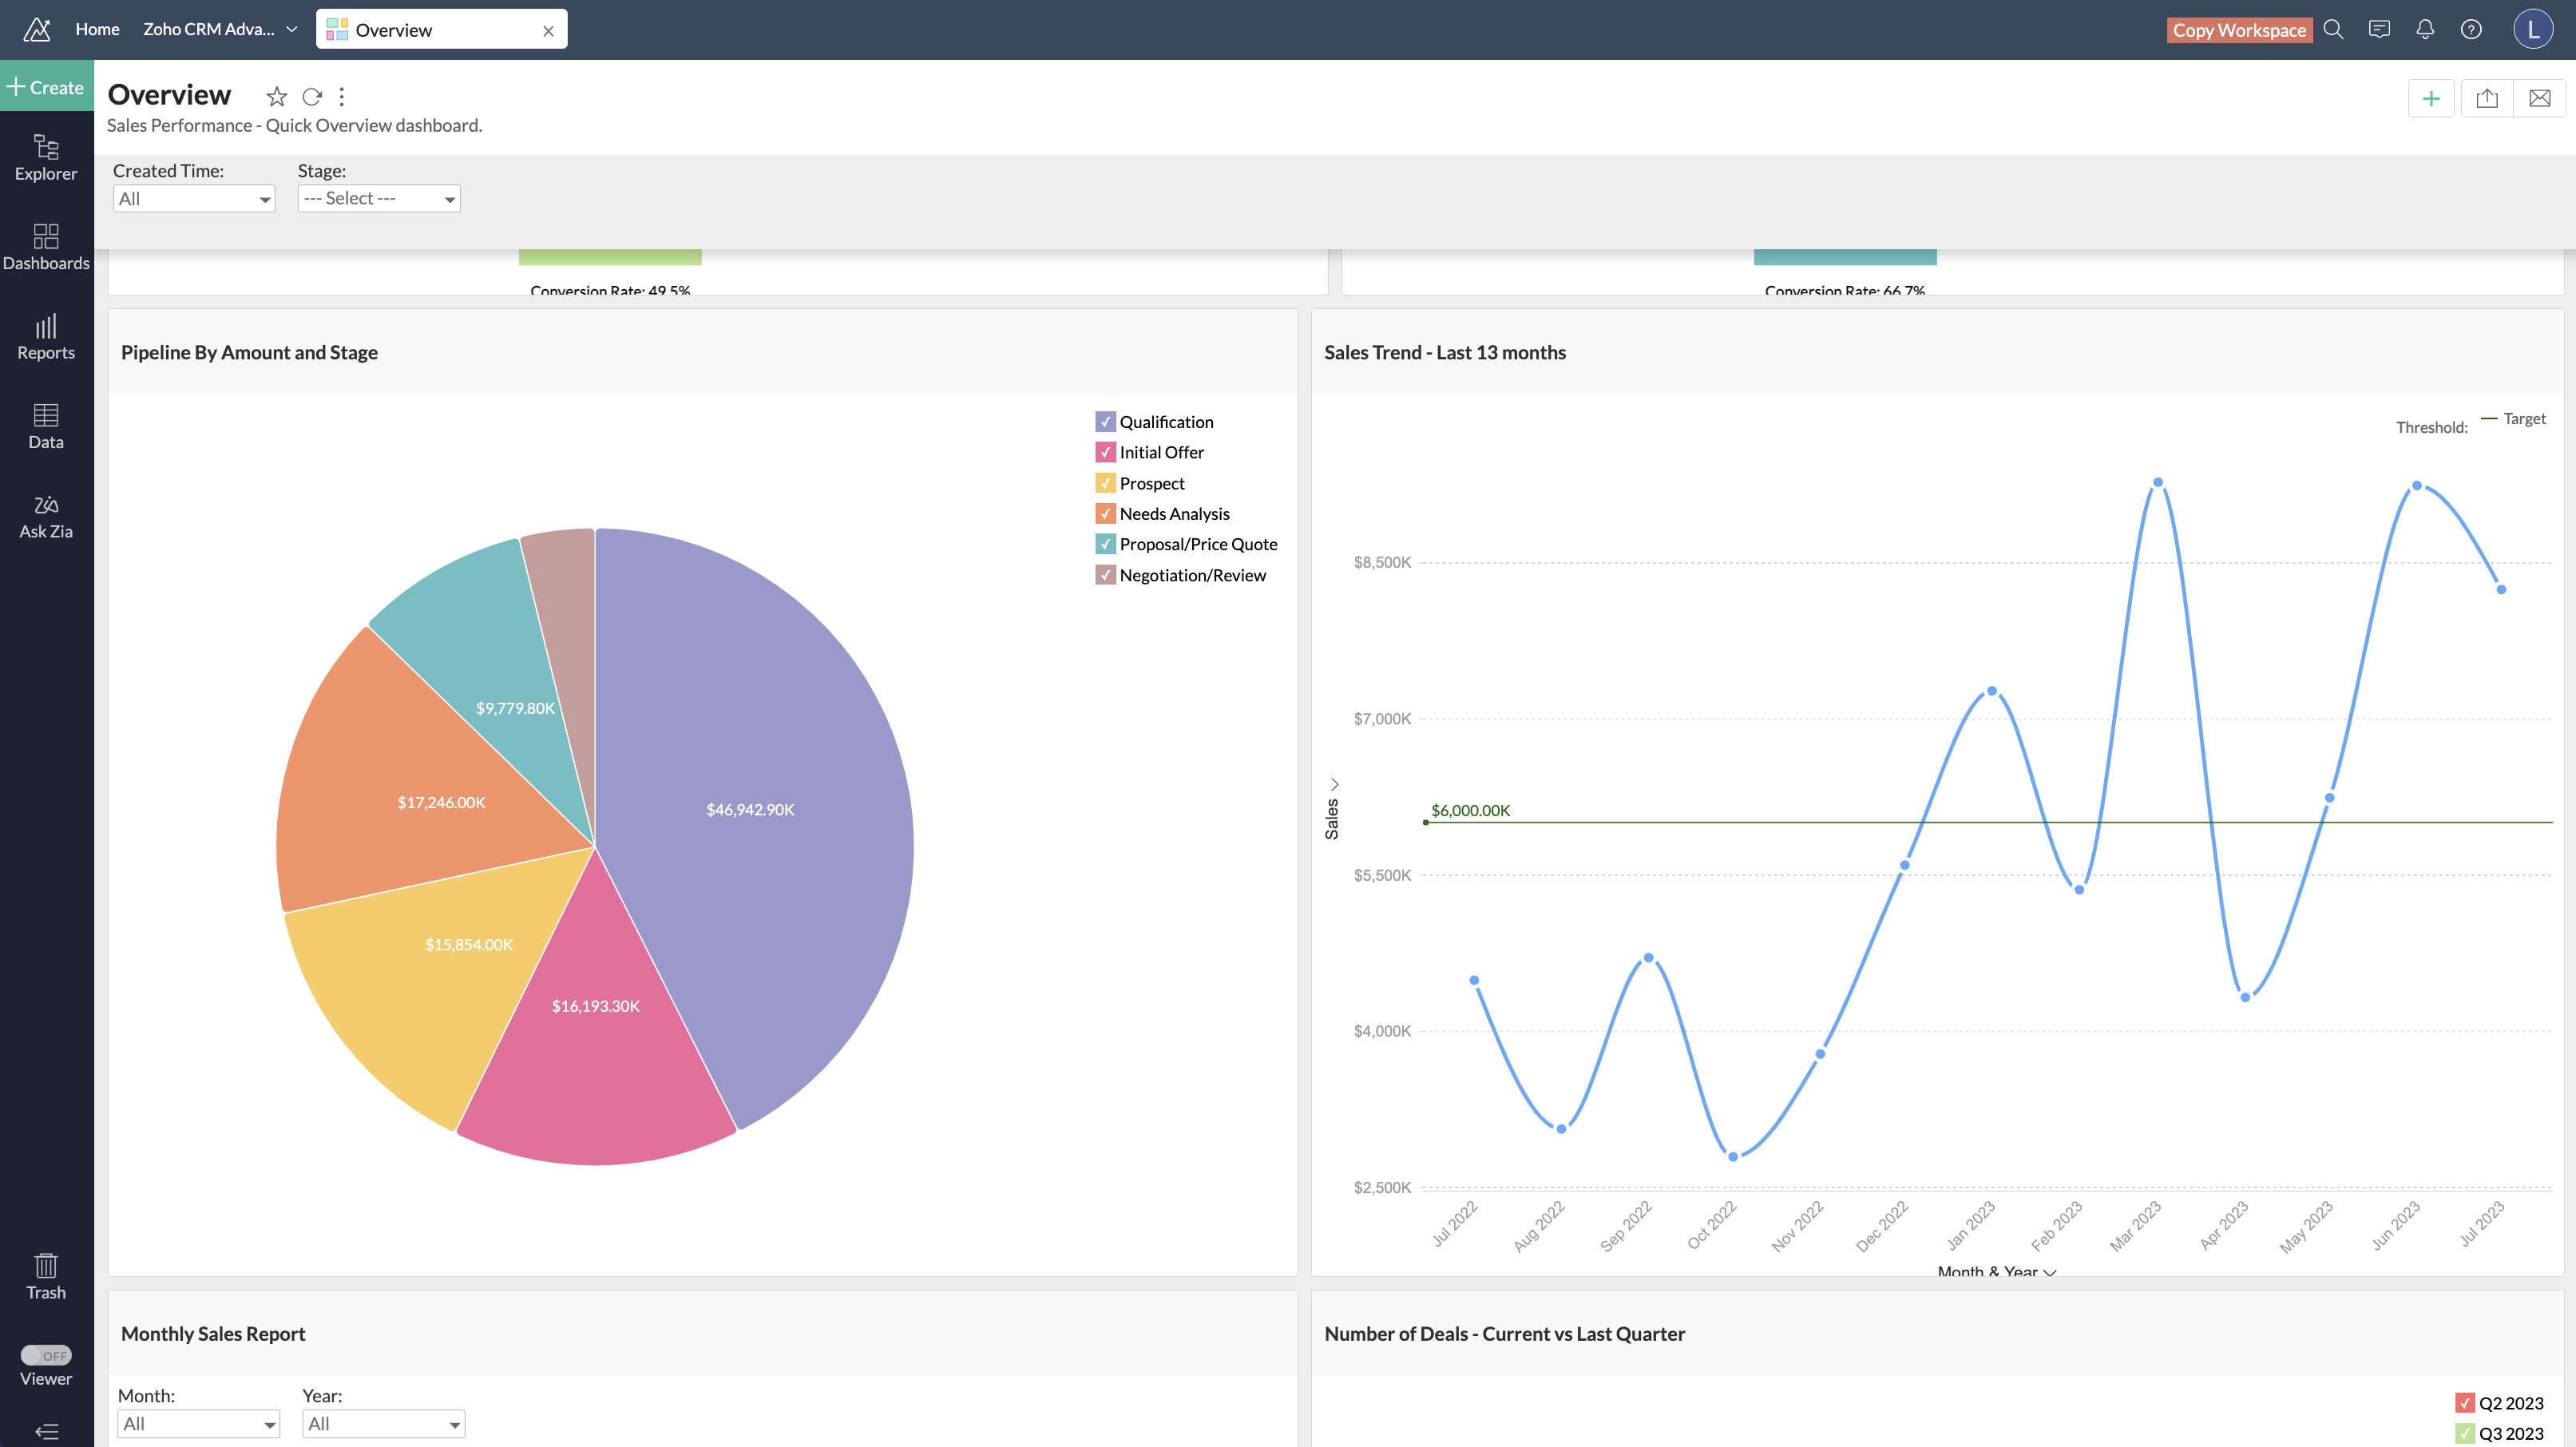
Real analytics solutions that transformed how businesses make decisions. Click any project to see the full story and live dashboard.
Real-time revenue tracking across online and physical stores
E-CommerceClick to view dashboard & story →
IoT-powered production efficiency optimization
ManufacturingClick to view dashboard & story →
Resource optimization & margin improvement
Professional ServicesClick to view dashboard & story →
Live MRR tracking & churn prediction
SaaS / TechnologyClick to view dashboard & story →
UK Fashion Retailer (Online + 12 Physical Stores)
E-CommerceSales data scattered across Shopify (online), Square (in-store POS), Google Analytics, Facebook Ads, and Xero accounting. Finance team spending 40+ hours monthly manually consolidating Excel reports.
Midlands Electronics Manufacturer
ManufacturingUnplanned downtime costing £12K+ per hour. No visibility into machine performance or maintenance needs. Quality issues discovered too late in production.
London Digital Marketing Agency (45 Staff)
Professional ServicesUnable to identify which clients were actually profitable. Team utilization unclear. Project budgets frequently overrun. Resource allocation based on gut feeling rather than data.
B2B SaaS Platform (Subscription-based)
SaaS / TechnologyMRR calculations done manually in spreadsheets. Churn analysis lagging by weeks. No visibility into customer health scores. Unable to predict revenue accurately.
Our structured 4-phase process transforms raw information into reliable, decision-ready intelligence.
We connect to your systems, unify your data and build clean, reliable foundations.
We uncover trends, performance drivers and predictive insights using advanced analytical methods.
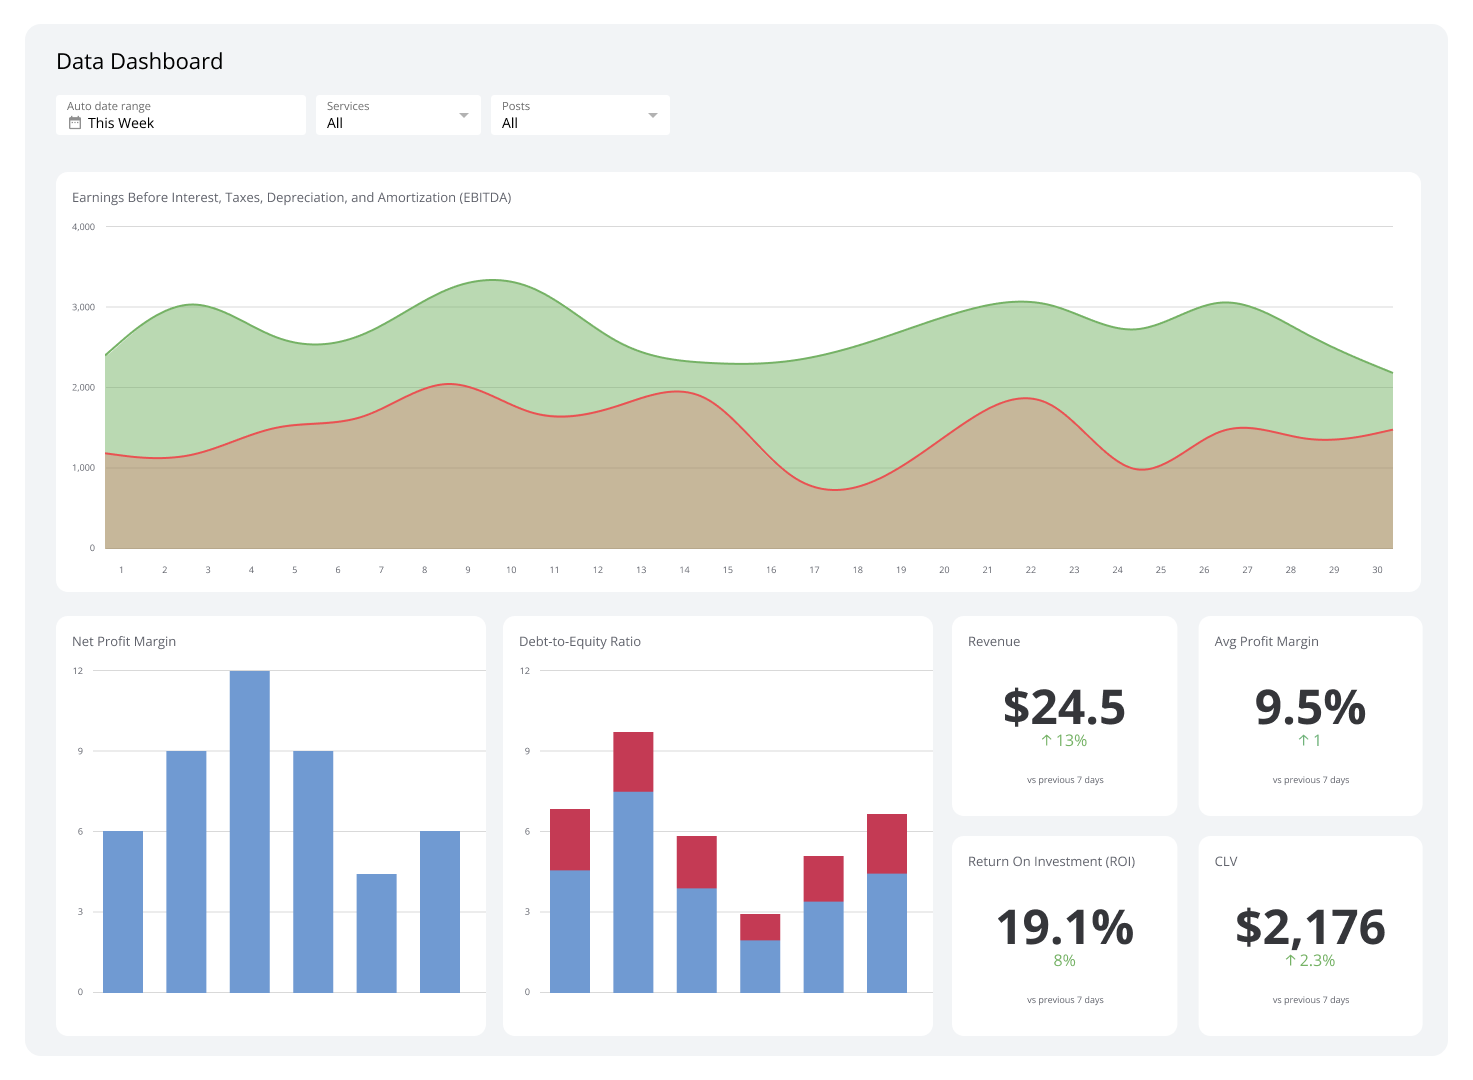
Interactive dashboards turn complex results into clear, actionable visuals.
You receive strategic guidance and clearly prioritised actions to support business growth.
We combine advanced analytics with commercial understanding to deliver insights that matter.
Dashboards built in days, not months. Rapid delivery using proven frameworks.
MSc-qualified analysts with cross-industry experience.
Enterprise-quality analytics at SME-friendly pricing.
Fully GDPR-aligned processes with strict data governance.
View insights on mobile, tablet or desktop seamlessly.
We provide training, troubleshooting and continual enhancements.
Our analytics frameworks apply seamlessly across multiple industries.
Customer trends, stock optimisation and conversion analysis.
Profitability tracking, utilisation metrics and performance reporting.
Patient outcomes, operational efficiency and demand forecasting.
Production performance, supply chain optimisation and predictive maintenance.
Campaign analytics, attribution and ROI measurement.
Risk analytics, compliance reporting and portfolio performance.
Guest experience tracking, booking trends and revenue optimization.
Student performance analytics, enrollment trends and resource allocation.
Route optimization, inventory management and delivery performance.
Project tracking, cost analysis and market trend insights.
Sales forecasting, inventory control and customer preference analysis.
Consumption patterns, demand forecasting and infrastructure optimization.
"The right data, clearly communicated, changes how organizations think and how they act."
Our Belief
Every project is unique. We create custom solutions based on your specific needs, data sources, and business objectives.
No hourly rates or hidden costs. You'll receive a transparent, fixed-price quote based on your project scope.
After understanding your requirements, we create a detailed proposal tailored to your business needs.
We offer payment plans to suit businesses of all sizes, with options for deposits and milestone-based payments.
Book a free 30-minute consultation and we'll create a custom proposal tailored to your needs and budget. No obligation, completely transparent pricing.
Book Free Consultation →✓ Free consultation ✓ Custom quote ✓ Fixed-price projects
Your common questions answered.
Pricing varies based on project complexity, data sources, and requirements. We provide custom quotes after understanding your specific needs. Book a free consultation to receive a tailored proposal.
Excel/CSV, SQL/NoSQL databases, APIs, CRM platforms (Salesforce, HubSpot), cloud tools (Google Analytics, Shopify), and more. We work with virtually any data source.
Simple projects: 2–3 weeks. Standard projects: 3–4 weeks. Complex projects: 4–8 weeks. Timeline depends on scope, data sources, and complexity.
No. Our dashboards are intuitive and we provide comprehensive training. If you can use Excel, you can use our analytics solutions.
Power BI, Tableau, Looker Studio, Python, R, and custom solutions. We recommend the best tool based on your needs, budget, and existing tech stack.
Typically 50% deposit to start, 50% on completion. For larger projects, we offer milestone-based payments (30/40/30). Upfront payment discounts available.
Yes. We are ICO-registered and fully GDPR-compliant with encryption in transit and at rest. We sign NDAs and work within your security requirements. Your data is never shared with third parties.
All projects include 30 days of post-launch support for questions, troubleshooting, and minor adjustments. Extended support available separately.